 Thousands of brain imaging studies are published each year. A subset of these studies are replications, or slight variations, of previous studies. Attempting to come to a solid conclusion based on the complex brain activity patterns reported by all these replications can be daunting. Meta-analysis is one tool that has been used to make sense of it all.
Meta-analyses take locations of brain activity in published scientific papers and pool them together to see if there is any consistency.
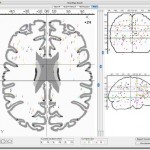
This is typically done using a standardized brain that all the studies fit their data to (e.g., Talairach).  Activation coordinates are then placed on a template brain as dots. When dots tend to clump together then the author can claim some consistency is present across studies. See the first figure for an example of this kind of result.
More sophisticated ways of doing this have emerged, however. One of these advanced methods is called activation likelihood estimation (ALE). This method was developed by Peter Terkeltaub et al. (in conjunction with Jason Chein and Julie Fiez) in 2002 and extended by Laird et al. in 2005.
ALE computes the probability of each part of the brain being active across studies. This is much more powerful than simple point-plotting because it takes much of the guess-work out of deciding if a result is consistent across studies or not.
These kinds of statistics are very important, given that science loves to set the probability of being wrong at less than 5%. This means that around 5% of all results should be wrong, just by random chance! Meta-analyses can help reduce this problem by computing the probability that a finding is wrong across studies.
A very useful software package for running ALE analyses, GingerALE, has been released to the public. The software is quite easy to use, and can aid in the understanding of brain function. The ease and speed of getting meta-analysis results means that simple curiosity can lead to a larger understanding of the brain (via the neuroimaging literature) in very little time.
Here’s how to run an ALE analysis:
- You can type coordinates from published articles into GingerALE. Even better, though, is to use another software package, Sleuth, to search for studies of interest. Go ahead and download and install Sleuth.
- Open Sleuth and click on ‘Experiments’. Then find one or several experiment types under ‘Paradigm Class’ and add them to your search. You can refine your search as you see fit. Click ‘Start Search’. (Note that they’ve been having trouble with their server recently; you may need to try later if it isn’t working.)
- Select all of the results and click ‘Download All’
- You should now be able to see a point-plot of the results under the ‘Plot’ tab.
- For more precise and informative results, you need GingerALE. In Sleuth, go to the menu bar and under Export click on ‘Locations (Text)’. Then go ahead and download GingerALE.
- In GingerALE, click on File>’Open Foci’. Then select the text file with the activation coordinates you exported from Sleuth.
- Basically, you’ll want to start at the top of the window in GingerALE, and work your way down. Start by computing the ALE. Then the permutation testing (the slowest step to complete). You can then correct for multiple comparisons using false discovery rate. Finally, apply the thresholding. The default values in each of these steps should work fine.
- Once you have your output, you can view it in a program called MRIcron. Instructions on how to use this program are available. You will need a structural MRI images to overlay your ALE analysis onto, which can be found here: Colin1.1.nii. Next, just open Colin1.1.nii in MRIcron, click Overlay>’Add’, and select your ALE output file.
- You should see a map of the likely activity across the studies you searched for!
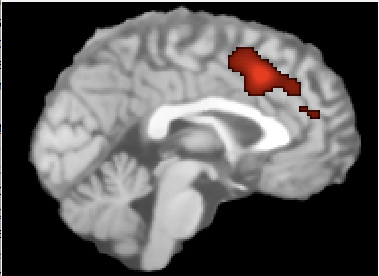
Here is an example of a result from an ALE meta-analysis of the Stroop task (increased brightness indicates increased probability of brain activity across studies):
-MWCole

